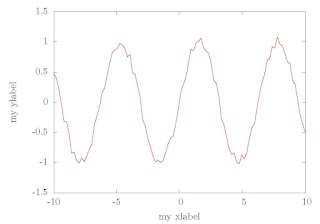
We know that some packages used latex can deal with multi-language typesetting. And we also know that gnuplot have terminals like latex, epslatex. So we can first plot a English graph with these terminals, then modify the output tex files, and at last get a multi-language supported graph. Take Chinese support for example.
We first plot a graph using the following script.
reset
set term epslatex color standalone
set output "voltage.tex"
set xlabel "my xlabel"
set ylabel "my ylabel"
unset key
plot sin(x)+0.1*(2*rand(0)-1.) w l lw 2
set output
Compile the output tex file using latex we get a graph like the following one.
 |
| Gnuplot plotted graph without Chinese support |
\put(4039,154){\makebox(0,0){\strut{}my xlabel}}%
and
\put(308,2739){\rotatebox{-270}{\makebox(0,0){\strut{}my ylabel}}}
Then we repalce "my xlabel" with "时间(秒)", "my ylabel" with "电压(伏)". And add the following codes into the header part of the file to get the chinese support of latex.
\usepackage{CJK}
\AtBeginDocument{\begin{CJK*}{GBK}{song}}
\AtEndDocument{\end{CJK*}}
 |
| Gnuplot plotted graph with Chinese support |
voltage.tex voltage_chinese.tex

How to use latex in gnuplot while I set output filetype to png?
ReplyDeletemilk:
ReplyDeleteYou know that latex only deal with pictures with format ps and eps. For other formats you should do the conversion first.
Your blog is great! Keep up the good work :)
ReplyDeleteThis is so fun! What a great idea. Also I love how authentic you seem to be. Your style and passion for blogging is contagious. Thank you for sharing your life!
ReplyDeletehow to change the language also of the month names on a time axis?
ReplyDeleteset xdata time
set format x "%b-%d"