I will talk about convert a colorized rgb image to a gray one using gnuplot in this article.
Amazing it is to edit pictures with gnuplot. Yes, it is a little amazing, this kind of works should left to picture editors in fact. But I will show you gnuplot can also do it well.
In a rgb image, the color of a point is marked with (r,g,b) where r,g and b can be and always are diffrent values. While for a gray one r,g and b must be the same. So to convert a rgb image to a gray one, we should convert (r,g,b) to (gray,gray,gray). Once we known how to do it, the problem becomes easy. Now we come to write our gnuplot script.
#Utility:Convert a rgb colorized image to a gray one
#Author:数声风笛离亭晚,我想潇湘君想秦!
#Email:qinjieli@gmail.com
#Usage:
##call "rgbtogray.gnuplot" inputfile outputfile
#parameters:
##inputfile: input filename (without ".png")
##outputfile: outputfilename (without ".png")
reset
inputfile="$0.png"
outputfile="$1.png"
plot inputfile binary filetype=png w rgbimage
xmax=GPVAL_DATA_X_MAX
xmin=GPVAL_DATA_X_MIN
ymin=GPVAL_DATA_Y_MIN
ymax=GPVAL_DATA_Y_MAX
set xrange [xmin:xmax]
set yrange [ymin:ymax]
#get the size of the picture
gray(r,g,b)=0.299*r + 0.587*g + 0.114*b
#The function which convert rgb color to gray.
#At first I choose the three weighting all to be 0.333,
#but a firend told me it will be better to use these values
set size ratio -1
# Set the scales so that the unit has the same length
#on both the x and y axes
#########################
#There should not be any margin in the output picture
set lmargin 0
set rmargin 0
set tmargin 0
set bmargin 0
unset key   #The key, border and tics are all do not need
unset border
unset tics
#set terminal and output file name
set term png size (xmax-xmin),(ymax-ymin)
set output outputfile
#Plot with gray color
plot inputfile\
     u (gray(column(1),column(2),column(3))):\
       (gray(column(1),column(2),column(3))):\
       (gray(column(1),column(2),column(3)))\
     binary filetype=png w rgbimage
Save the script as "rgbtogray.gnuplot", then it can be called like this:
gnuplot> call "rgbtogray.gnuplot" inputfile outputfile
The following is two groups of our input and ouput files. The initial input files are copied from
here and
here (Thanks the original picture author!).
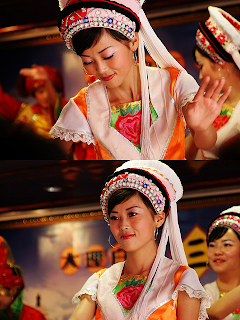 |
| Input file-1 |
 |
| Output file-1 |
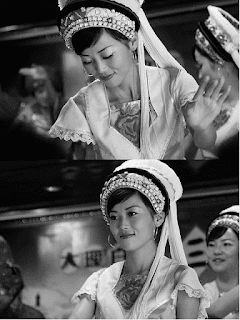
 |
| Input file-2 |
 |
| Output file-2 |


