Saturday, December 29, 2012

Pie charting with gnuplot

In two of my previous posts (post-1 post-2), I have talked about how to plot a pie chart using gnuplot. This time I will introduce a new method witch is much more simpler.

This new method will use the plotstyle "circle". And this feather is not provide since gnuplot version 4.6. So you have to update your gnuplot to a version not lower than 4.6.

set term post eps color enhanced size 5cm,5cm
set output "pie_chart.eps"

set size square
set xrange [-1:1]
set yrange [-1:1]
set style fill solid 1

unset border
unset tics
unset key

plot '-' with circle linecolor var
0 0 1 0   30  1
0 0 1 30  60  2
0 0 1 60  120 3
0 0 1 120 190 4
0 0 1 190 275 5
0 0 1 275 360 6
e
##the first two numbers 0 0 are the
# x and y coordinate of center
##the third number 1 is the radius
#of the circle
##the fourth and fifth number are the
#begin and end angle of the sector
##the last number is the color indicate

set output

Fig.1 Pie charting using gnuplot

Friday, November 30, 2012

Plot a pie chart using gnuplot

If your gnuplot version is not lower than 4.4, then plotting a pie chart can be done with command "set object circle...". The following is an example.

reset
set term postscript eps color enhanced size 5cm,5cm
set output "pie_chart.eps"

set size square
set style fill solid 1.0 border -1

set object 1 circle at screen 0.5,0.5 size \
  screen 0.45 arc [0   :50  ] fillcolor rgb "red" front
set object 2 circle at screen 0.5,0.5 size \
  screen 0.45 arc [50  :150] fillcolor rgb "orange" front
set object 3 circle at screen 0.5,0.5 size \
  screen 0.45 arc [150:220] fillcolor rgb "forest-green" front
set object 4 circle at screen 0.5,0.5 size \
  screen 0.45 arc [220:360] fillcolor rgb "dark-magenta" front

#plot a white line, i.e., plot nothing
unset border
unset tics
unset key
plot x with lines lc rgb "#ffffff"
set output

Fig.1 Plot a pie chart using gnuplot

If you think setting of the position, size and arc manually is very tedious, you may write a script with any programming language.

Follow this link to see a new simpler method to plot a pie chart.


Wednesday, October 31, 2012

Convertting a rgb color value to its hex-string

In a previous post, I have talked about how to convert a hex-string color to its rgbvalue. This time I will talk about the inversion, i.e., converting a rgb value color specification to its hex-string correspondence.

#pick the red color value out
red(rgbvalue)=rgbvalue/65536
#pick the green color value out
green(rgbvalue)=(rgbvalue%65536)/256
#pick the blue color value out
blue(rgbvalue)=rgbvalue%256
#convert dec color value to its hex string
dec2hex(dec)=gprintf("%02x",dec)
#convert rgb color value to its hex string
rgb2hex(color)="#".\
               dec2hex(red(color)).\
               dec2hex(green(color)).\
               dec2hex(blue(color))

color = 65535 #rgb-value 
print "The hex string of rgb-color ". color ." is: "
print rgb2hex(color)
plot cos(x) w line linecolor rgb rgb2hex(color)

Run this script, it will output the following string and picture.

The hex string of rgb color 65535 is: 
#00ffff

Fig.1 Converting from a rgb color specification to its hex-string


Saturday, September 29, 2012

Self-defined linestyle under gnuplot postscript terminal

In post http://gnuplot-surprising.blogspot.com/2012/07/self-defined-linestyle-under-gnuplot.html we have talked about self-defined linestyle under gnuplot svg terminal. Here we show how to realize the same effect under postscript terminal.

Assume you have plotted a graph using the following script.

set term post eps color enhanced
set output "self-defined_linestyle.eps"

plot sin(x) w l linestyle 1

set output

Open the outputed ps (or eps) file with any text editor, and find codes as the following:

% Default Line colors
/LCw {1 1 1} def
/LCb {0 0 0} def
/LCa {0 0 0} def
/LC0 {1 0 0} def
/LC1 {0 1 0} def
/LC2 {0 0 1} def
/LC3 {1 0 1} def
/LC4 {0 1 1} def
/LC5 {1 1 0} def
/LC6 {0 0 0} def
/LC7 {1 0.3 0} def
/LC8 {0.5 0.5 0.5} def
% Default Line Types
/LTw {PL [] 1 setgray} def
/LTb {BL [] LCb DL} def
/LTa {AL [1 udl mul 2 udl mul] 0 setdash LCa setrgbcolor} def
/LT0 {PL [8 dl1 1 dl2 1 dl1 1 dl2] LC0 DL} def
/LT1 {PL [4 dl1 2 dl2] LC1 DL} def
/LT2 {PL [2 dl1 3 dl2] LC2 DL} def
/LT3 {PL [1 dl1 1.5 dl2] LC3 DL} def
/LT4 {PL [6 dl1 2 dl2 1 dl1 2 dl2] LC4 DL} def
/LT5 {PL [3 dl1 3 dl2 1 dl1 3 dl2] LC5 DL} def
/LT6 {PL [2 dl1 2 dl2 2 dl1 6 dl2] LC6 DL} def
/LT7 {PL [1 dl1 2 dl2 6 dl1 2 dl2 1 dl1 2 dl2] LC7 DL} def
/LT8 {PL [2 dl1 2 dl2 2 dl1 2 dl2 2 dl1 2 dl2 2 dl1 4 dl2] LC8 DL} def

In the upper codes "/LC? {# # #} def" defines the line color, and "/LT? {Pl [#1 dl1 #2 dl2]LC?} def" defines the line type. "#1 dl1 #2 dl2" means the line is a dash line with #1 legth colored and #2 length blank.

Modify these codes as what you like, and save the file. For example, I use "/LT0 {PL [8 dl1 4 dl2 1 dl1 4 dl2 1 dl1 8 dl2] LC0 DL} def" to repalce the original "/LT0 {PL [] LC0 DL} def".

At last, open the modified postscript file with gsview (or any other postscript viewer), and you will find the linestyle have been changed. The following is the original and modifed graph respectively.

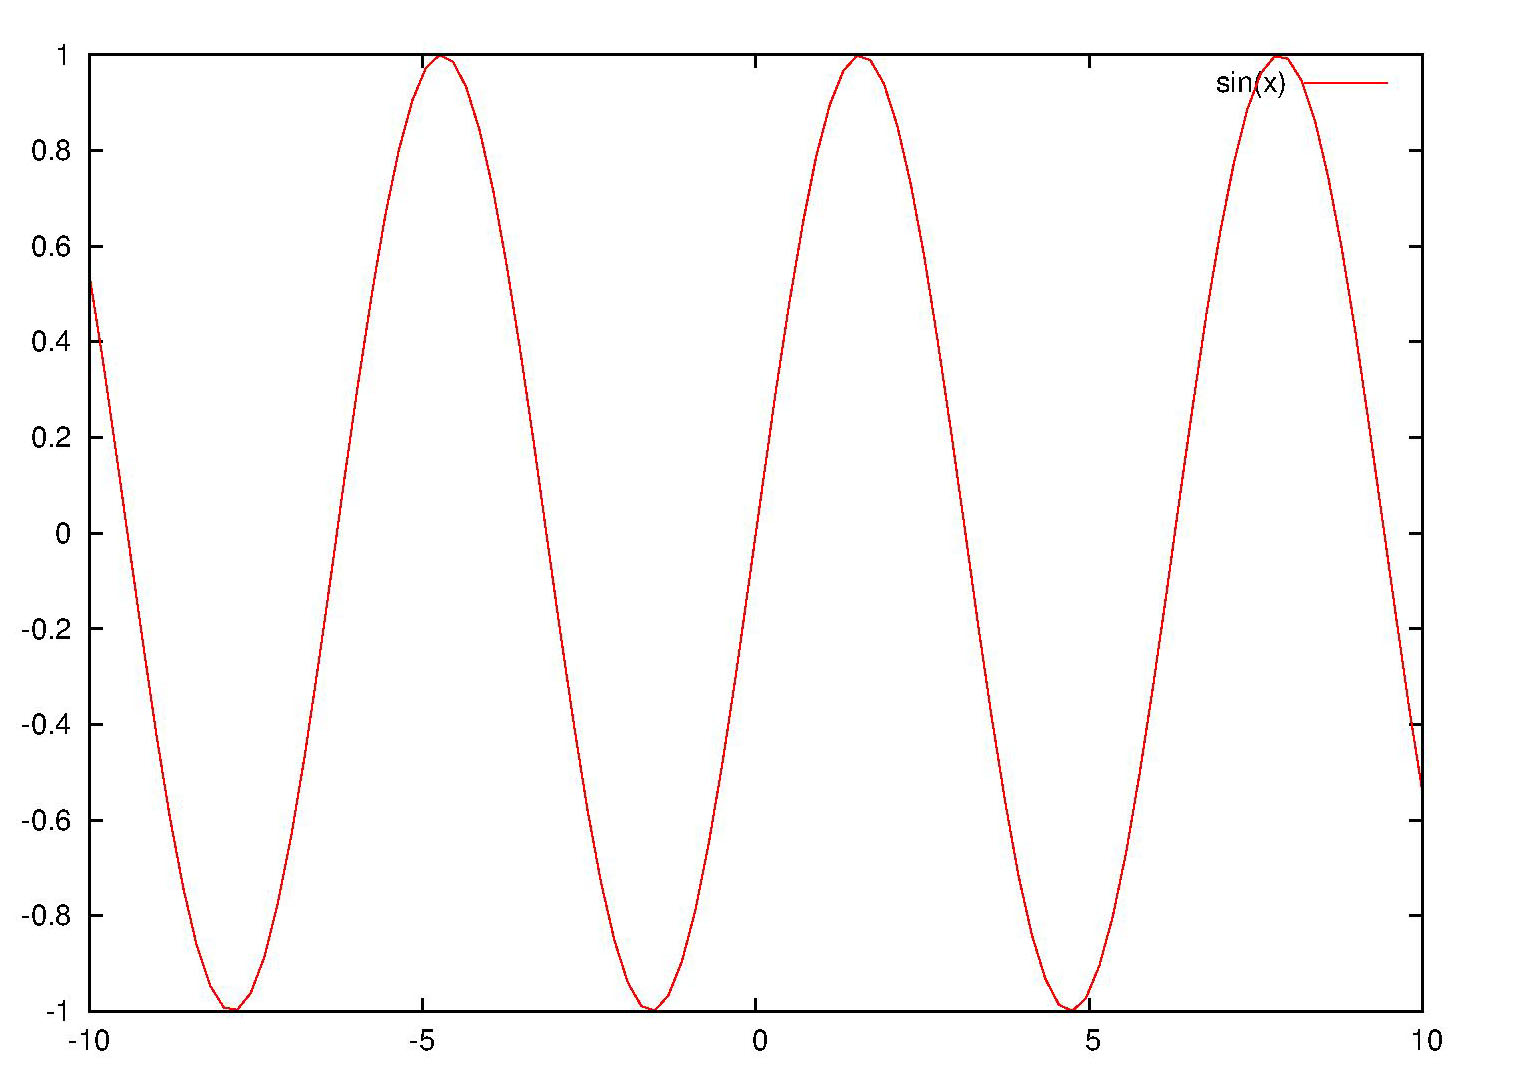
Fig.1 Original outputted picture
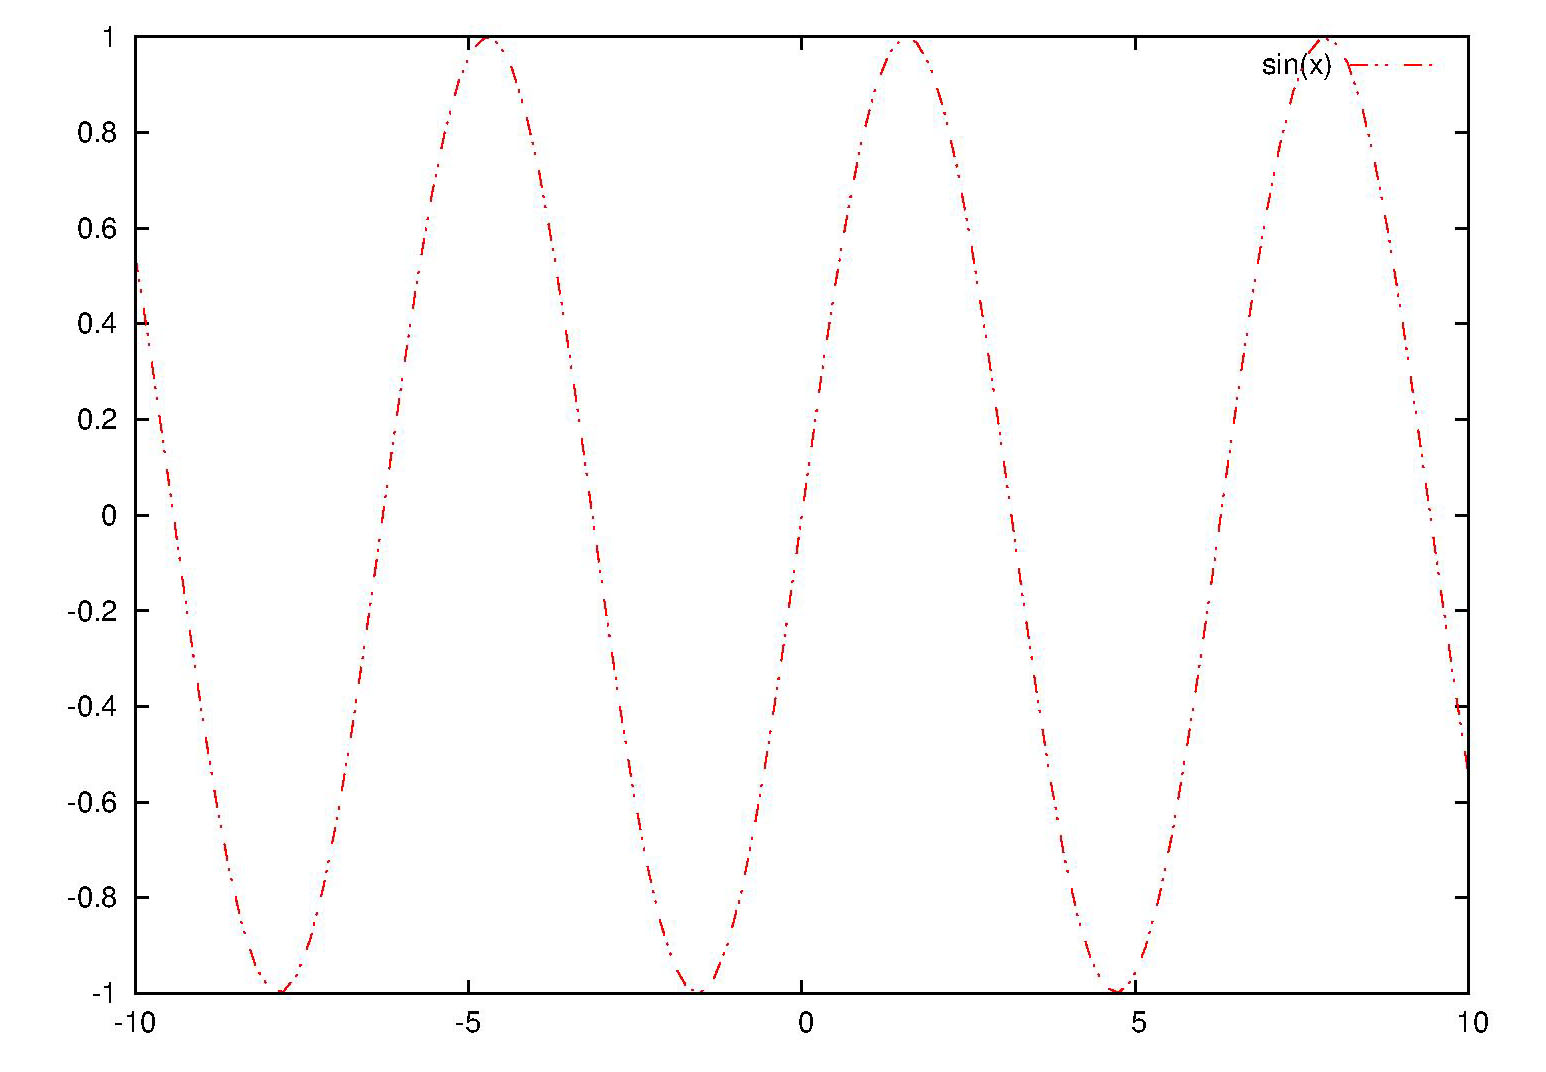
Fig.2 Modified outputted picture


Friday, August 24, 2012

Converting from a hex-string color to its rgbvalue

There are several ways to specify color when one plots using gnuplot.Among them hex-string (like "#0000ff") and rgbvalue (like "256") specification is very important. In this post we will talk about converting from a hex-string color to its rgbvalue (the inversion will be talked in another post).

reset
#pick the red color hex string out
red(colorstring)= colorstring[2:3]
#pick the green color hex string out
green(colorstring)=colorstring[4:5]
#pick the blue color hex string out
blue(colorstring)=colorstring[6:7]
#convert a hex string to its dec format
hex2dec(hex)=gprintf("%0.f",int('0X'.hex))
#calculate the rgb value from the r,g,b weight
rgb(r,g,b) = 65536*int(r)+256*int(g)+int(b)
#convert the hex color string to its rgb value.
hex2rgbvalue(color)=rgb(\
                        hex2dec(red(color)),\
                        hex2dec(green(color)),\
                        hex2dec(blue(color))\
                        ) 
set term png
set output "hex_string2rgbvalue.png"
plot 'color.dat' u 1:2:(hex2rgbvalue(stringcolumn(3)))\
              w lp pt 7 ps 3 lc rgb variable notitle
set output

File 'color.dat' has content like the following:
0 1 #ff0000
1 2 #00ff00
2 3 #0000ff
3 4 #ff00ff
4 5 #ffff00
5 6 #00ffff
0 6 #00ffff
1 5 #ffff00
2 4 #ff00ff
3 3 #0000ff
4 2 #00ff00
5 1 #ff0000

The output file 'hex_string2rgbvalue.png' looks like this:
Fig.1 Converting from a hex-string color to its rgb-value
Creative Commons License
Except as otherwise noted, the content of this page is licensed under a Creative Commons Attribution-NonCommercial-NoDerivs 3.0 Unported License.