Showing posts with label linestyle. Show all posts

Saturday, September 29, 2012

Self-defined linestyle under gnuplot postscript terminal

In post http://gnuplot-surprising.blogspot.com/2012/07/self-defined-linestyle-under-gnuplot.html we have talked about self-defined linestyle under gnuplot svg terminal. Here we show how to realize the same effect under postscript terminal.

Assume you have plotted a graph using the following script.

set term post eps color enhanced
set output "self-defined_linestyle.eps"

plot sin(x) w l linestyle 1

set output

Open the outputed ps (or eps) file with any text editor, and find codes as the following:

% Default Line colors
/LCw {1 1 1} def
/LCb {0 0 0} def
/LCa {0 0 0} def
/LC0 {1 0 0} def
/LC1 {0 1 0} def
/LC2 {0 0 1} def
/LC3 {1 0 1} def
/LC4 {0 1 1} def
/LC5 {1 1 0} def
/LC6 {0 0 0} def
/LC7 {1 0.3 0} def
/LC8 {0.5 0.5 0.5} def
% Default Line Types
/LTw {PL [] 1 setgray} def
/LTb {BL [] LCb DL} def
/LTa {AL [1 udl mul 2 udl mul] 0 setdash LCa setrgbcolor} def
/LT0 {PL [8 dl1 1 dl2 1 dl1 1 dl2] LC0 DL} def
/LT1 {PL [4 dl1 2 dl2] LC1 DL} def
/LT2 {PL [2 dl1 3 dl2] LC2 DL} def
/LT3 {PL [1 dl1 1.5 dl2] LC3 DL} def
/LT4 {PL [6 dl1 2 dl2 1 dl1 2 dl2] LC4 DL} def
/LT5 {PL [3 dl1 3 dl2 1 dl1 3 dl2] LC5 DL} def
/LT6 {PL [2 dl1 2 dl2 2 dl1 6 dl2] LC6 DL} def
/LT7 {PL [1 dl1 2 dl2 6 dl1 2 dl2 1 dl1 2 dl2] LC7 DL} def
/LT8 {PL [2 dl1 2 dl2 2 dl1 2 dl2 2 dl1 2 dl2 2 dl1 4 dl2] LC8 DL} def

In the upper codes "/LC? {# # #} def" defines the line color, and "/LT? {Pl [#1 dl1 #2 dl2]LC?} def" defines the line type. "#1 dl1 #2 dl2" means the line is a dash line with #1 legth colored and #2 length blank.

Modify these codes as what you like, and save the file. For example, I use "/LT0 {PL [8 dl1 4 dl2 1 dl1 4 dl2 1 dl1 8 dl2] LC0 DL} def" to repalce the original "/LT0 {PL [] LC0 DL} def".

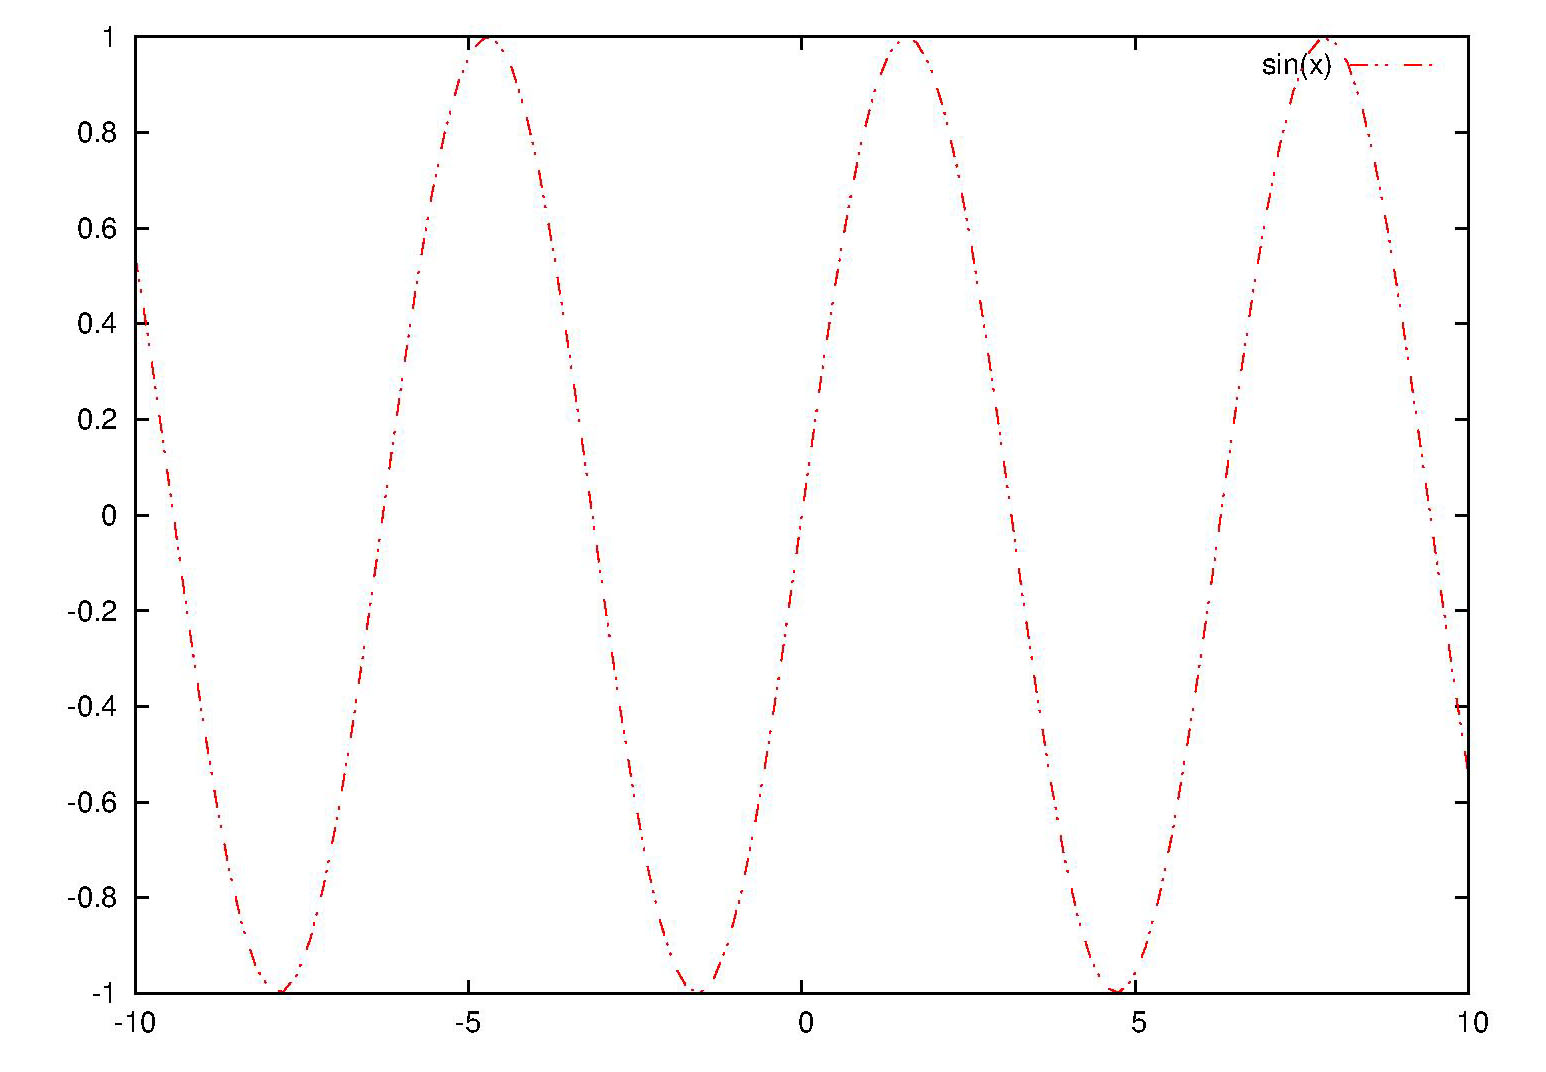
At last, open the modified postscript file with gsview (or any other postscript viewer), and you will find the linestyle have been changed. The following is the original and modifed graph respectively.
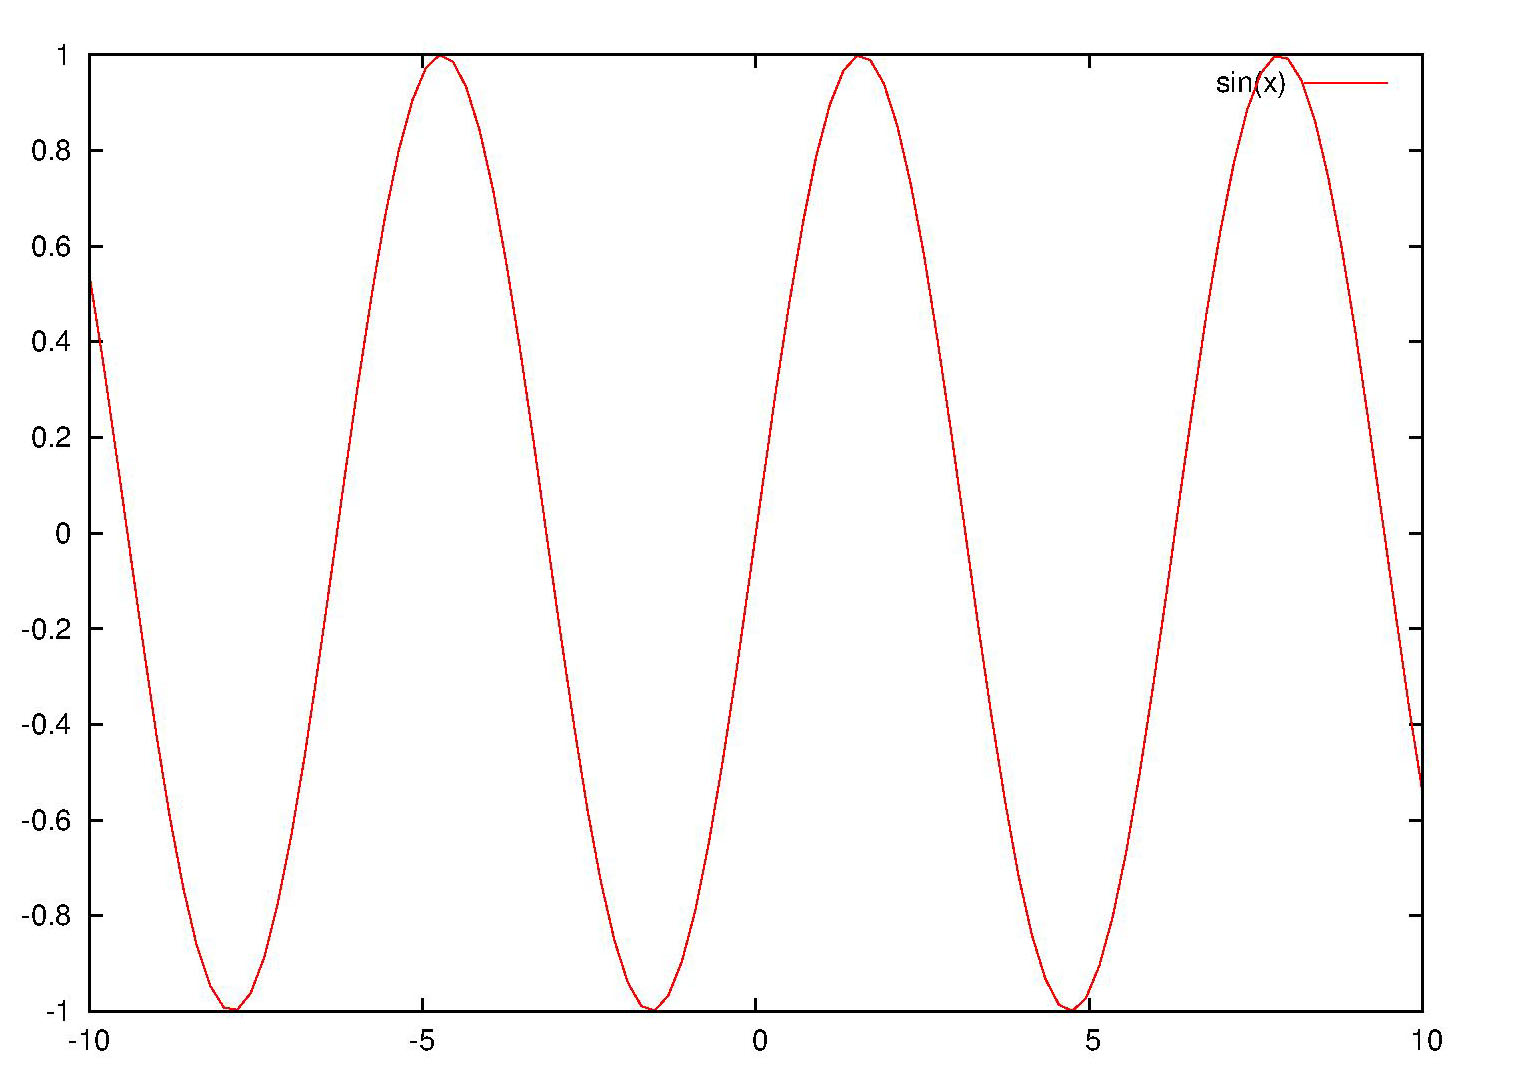
Fig.1 Original outputted picture
Fig.2 Modified outputted picture


Saturday, July 7, 2012

Self-defined linestyle under gnuplot svg terminal

Gnuplot have defined a series of line styles. But maybe you still have not find the one which is just appropriate for you. For example,when you want to use a dash-dot-dot line, you find there is not such a linestyle.

When you are using svg teminal (self-defined linestyle under postscript terminal will be talked in another post) this problem can solved easily. Fisrt, plot your file with solid line.

set term svg
set output "sin.svg"
plot sin(x) with line
set output

After that, open the svg file with a text-editor, and find codes like the following:

<g id="gnuplot_plot_1" >
<title>gnuplot_plot_1</title>
<g style=" fill:none; color:red; 
  stroke:currentColor; stroke-width:1.00; 
  stroke-linecap:butt; stroke-linejoin:miter">

Then change it to

<g id="gnuplot_plot_1" >
<title>gnuplot_plot_1</title>
<g style="stroke-dasharray: 7,2,2,2,2,2; 
  fill:none; color:red; stroke:currentColor; 
  stroke-width:1.00; stroke-linecap:butt; 
  stroke-linejoin:miter">

This time open your svg file, and you find the line sytle has changed. The follwing picture is a screen capture of "sin.svg".

Fig.1 Self-defined linestyle under gnuplot svg terminal

To further understand this post, you may google "stroke-dasharray + svg".
Creative Commons License
Except as otherwise noted, the content of this page is licensed under a Creative Commons Attribution-NonCommercial-NoDerivs 3.0 Unported License.