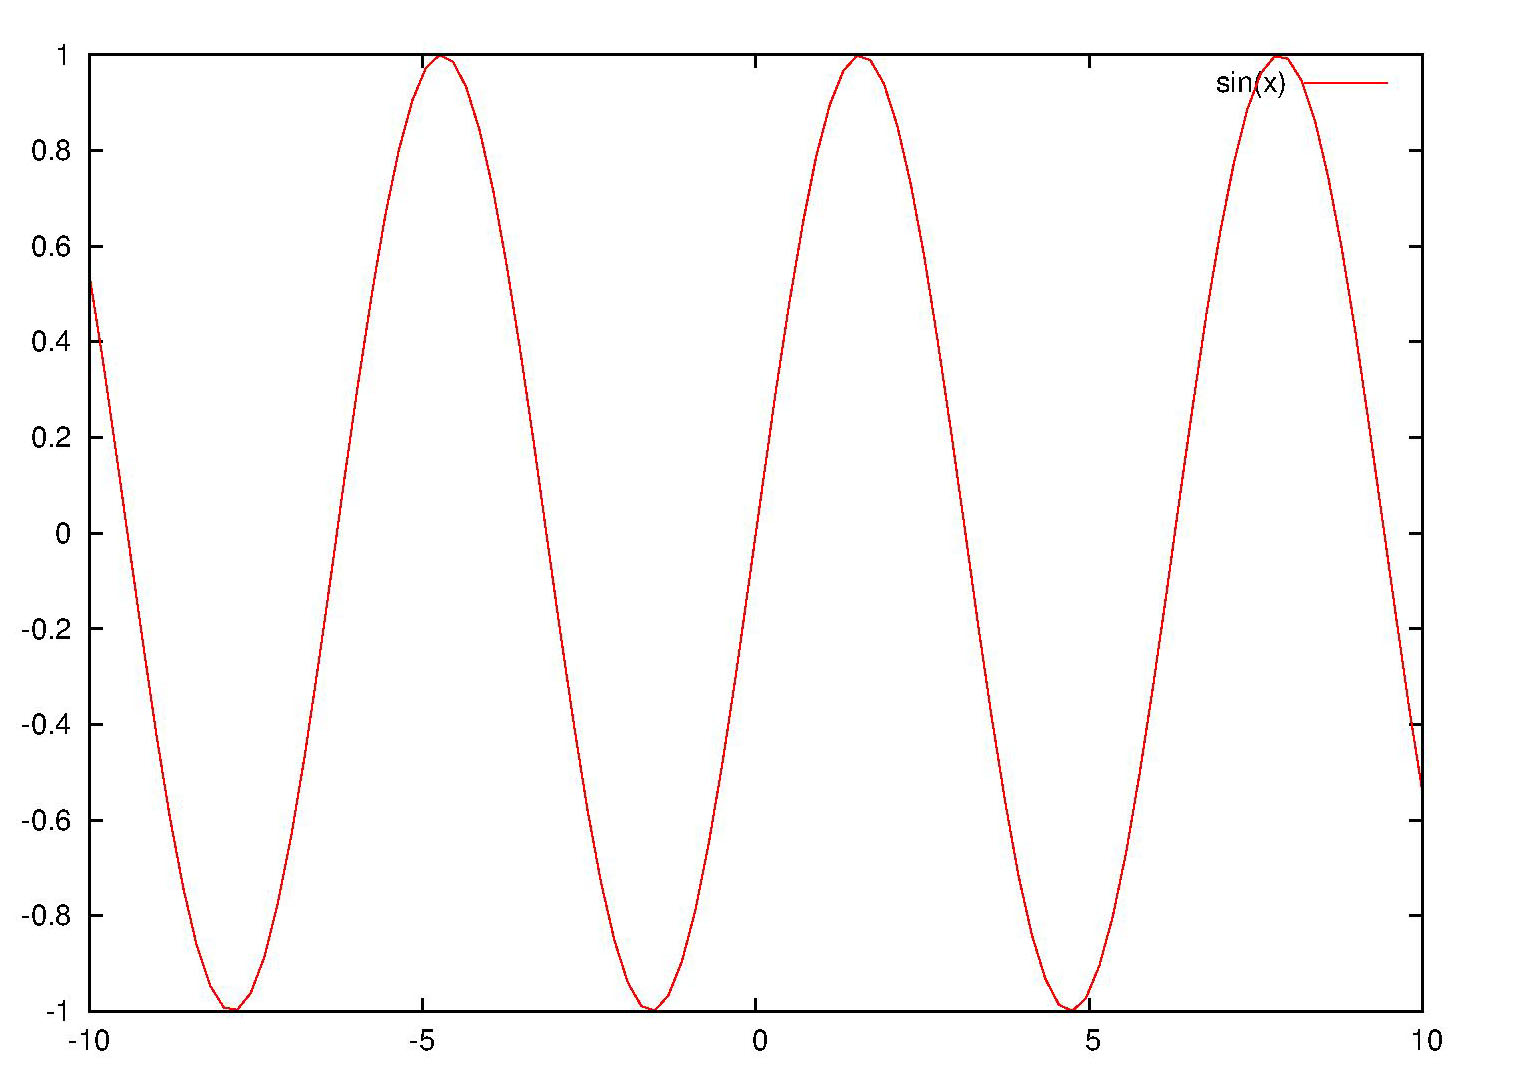
Assume you have plotted a graph using the following script.
set term post eps color enhanced
set output "self-defined_linestyle.eps"

plot sin(x) w l linestyle 1

set output
Open the outputed ps (or eps) file with any text editor, and find codes as the following:
% Default Line colors
/LCw {1 1 1} def
/LCb {0 0 0} def
/LCa {0 0 0} def
/LC0 {1 0 0} def
/LC1 {0 1 0} def
/LC2 {0 0 1} def
/LC3 {1 0 1} def
/LC4 {0 1 1} def
/LC5 {1 1 0} def
/LC6 {0 0 0} def
/LC7 {1 0.3 0} def
/LC8 {0.5 0.5 0.5} def
% Default Line Types
/LTw {PL [] 1 setgray} def
/LTb {BL [] LCb DL} def
/LTa {AL [1 udl mul 2 udl mul] 0 setdash LCa setrgbcolor} def
/LT0 {PL [8 dl1 1 dl2 1 dl1 1 dl2] LC0 DL} def
/LT1 {PL [4 dl1 2 dl2] LC1 DL} def
/LT2 {PL [2 dl1 3 dl2] LC2 DL} def
/LT3 {PL [1 dl1 1.5 dl2] LC3 DL} def
/LT4 {PL [6 dl1 2 dl2 1 dl1 2 dl2] LC4 DL} def
/LT5 {PL [3 dl1 3 dl2 1 dl1 3 dl2] LC5 DL} def
/LT6 {PL [2 dl1 2 dl2 2 dl1 6 dl2] LC6 DL} def
/LT7 {PL [1 dl1 2 dl2 6 dl1 2 dl2 1 dl1 2 dl2] LC7 DL} def
/LT8 {PL [2 dl1 2 dl2 2 dl1 2 dl2 2 dl1 2 dl2 2 dl1 4 dl2] LC8 DL} def
In the upper codes "/LC? {# # #} def" defines the line color, and "/LT? {Pl [#1 dl1 #2 dl2]LC?} def" defines the line type. "#1 dl1 #2 dl2" means the line is a dash line with #1 legth colored and #2 length blank.
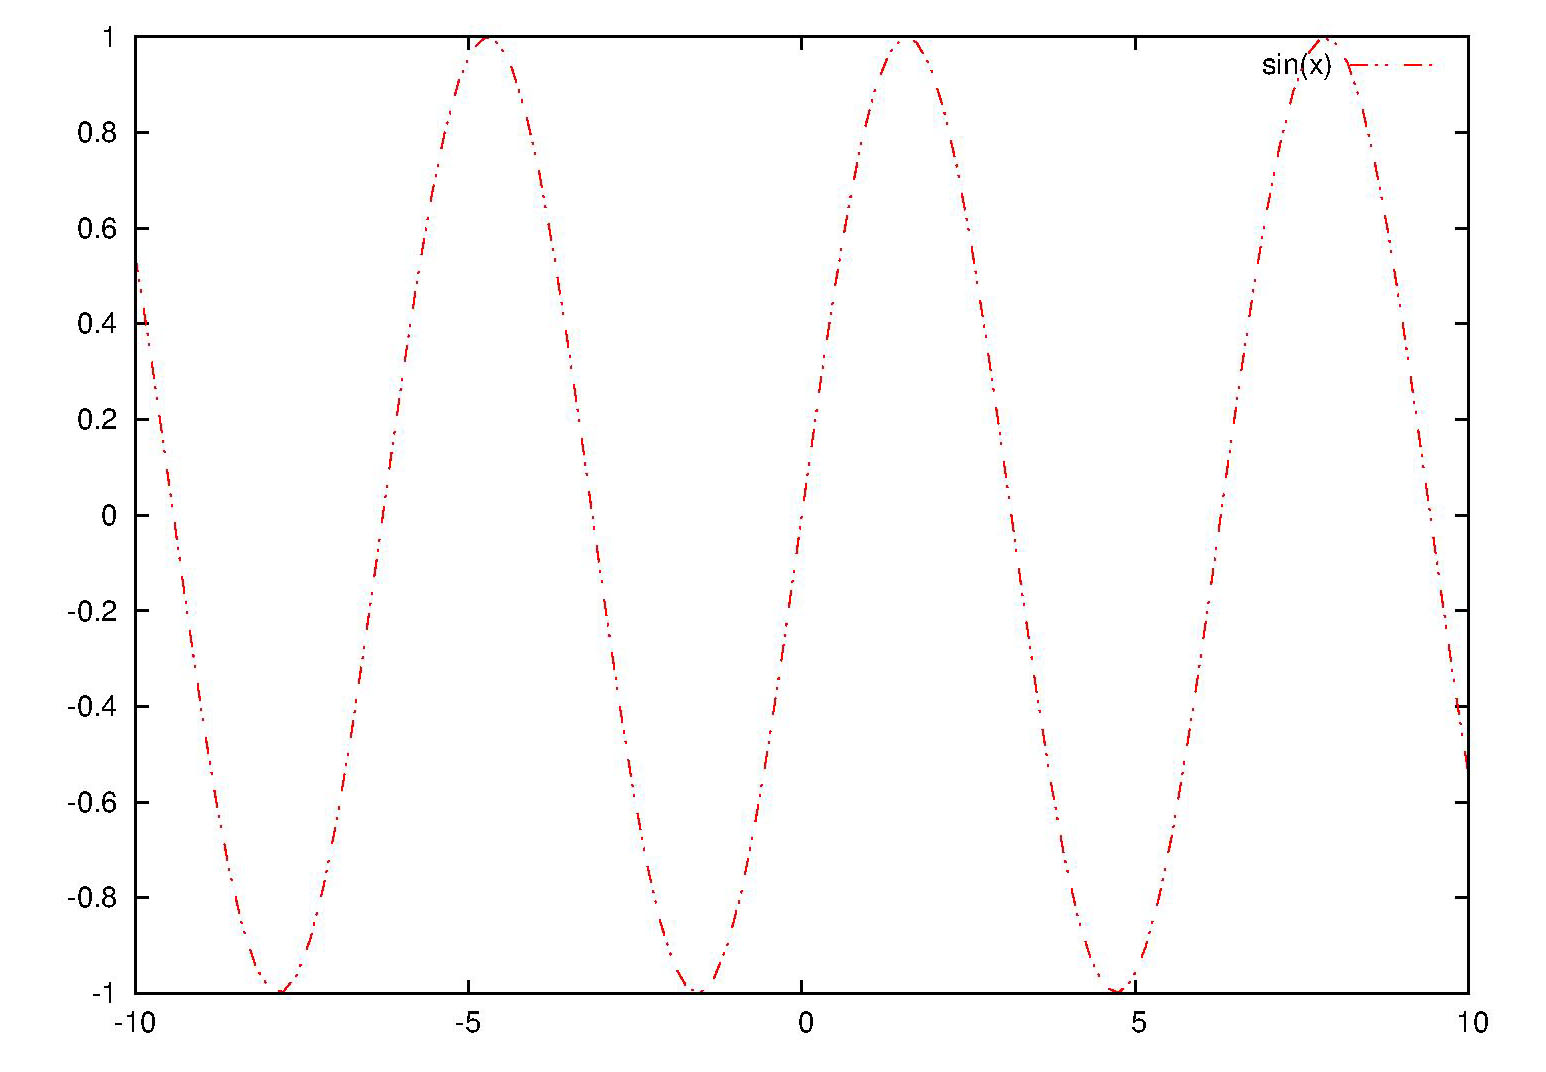
Modify these codes as what you like, and save the file. For example, I use "/LT0 {PL [8 dl1 4 dl2 1 dl1 4 dl2 1 dl1 8 dl2] LC0 DL} def" to repalce the original "/LT0 {PL [] LC0 DL} def".
At last, open the modified postscript file with gsview (or any other postscript viewer), and you will find the linestyle have been changed. The following is the original and modifed graph respectively.
 |
| Fig.1 Original outputted picture |
 |
| Fig.2 Modified outputted picture |