For some non-English speakers, inserting some their own characters into the graph is usual. And for some fresh, this some times becomes a challenging task. This posts will talk about how to solve this problem using latex.
We know that some packages used latex can deal with multi-language typesetting. And we also know that gnuplot have terminals like latex, epslatex. So we can first plot a English graph with these terminals, then modify the output tex files, and at last get a multi-language supported graph. Take Chinese support for example.
We first plot a graph using the following script.
reset
set term epslatex color standalone
set output "voltage.tex"
set xlabel "my xlabel"
set ylabel "my ylabel"
unset key
plot sin(x)+0.1*(2*rand(0)-1.) w l lw 2
set output
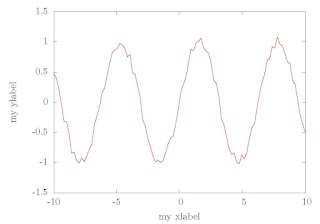
Compile the output tex file using latex we get a graph like the following one.
 |
| Gnuplot plotted graph without Chinese support |
And we want to label the x-axes with "时间(秒)"(means time) and y-axes with "电压(伏)"(means voltage). To realize this effect, we open the tex file with any text editor and find lines
\put(4039,154){\makebox(0,0){\strut{}my xlabel}}%
and
\put(308,2739){\rotatebox{-270}{\makebox(0,0){\strut{}my ylabel}}}
Then we repalce "my xlabel" with "时间(秒)", "my ylabel" with "电压(伏)". And add the following codes into the header part of the file to get the chinese support of latex.
\usepackage{CJK}
\AtBeginDocument{\begin{CJK*}{GBK}{song}}
\AtEndDocument{\end{CJK*}}
This time compile the tex file uising latex again. And a chinese supported graph is gotten.
 |
| Gnuplot plotted graph with Chinese support |
The modified and pre-modified tex files can be downloaded here.
voltage.tex voltage_chinese.tex

